Pacific Country Report
Sea Level & Climate:
Their Present State
Kiribati
June 2002
This project is sponsored by the Australian Agency for International Development (AusAID), managed by Australian Marine Science and Technology Ltd (AMSAT), and supported by NTF Australia at the Flinders University of South Australia.
The views expressed in this publication are those of the authors and not necessarily those of the Australian Agency for International Development (AusAID)
PACIFIC COUNTRY REPORT
ON
SEA LEVEL & CLIMATE: THEIR PRESENT STATE
KIRIBATI
June 2002
Executive Summary
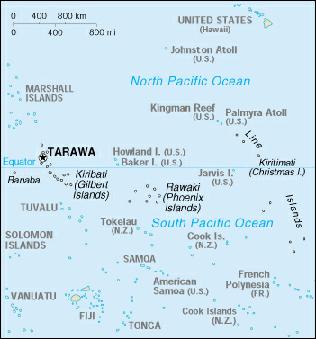
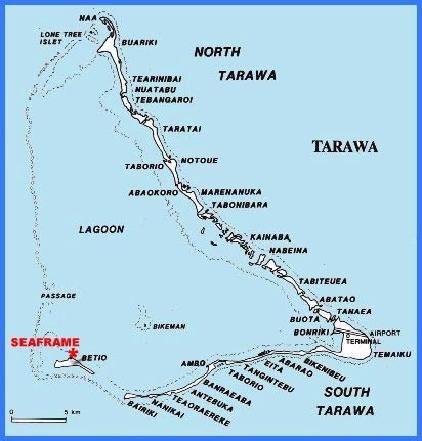
●A SEAFRAME gauge was installed in Betio, Tarawa, Kiribati, in December 1992. It records sea level, air and water temperature, atmospheric pressure, wind speed and direction. It is one of an array designed to monitor changes in sea level and climate in the Pacific.
●This report summarises the findings to date, and places them in a regional and historical context.
●The sea level trend to date is +0.1 mm/year (as compared to a global average of 1-2 mm/year) but the magnitude of the trend continues to vary widely from month to month as the data set grows. Nearby gauges, with longer records but less precision and datum control, show trends of –0.68 and +0.27 mm/year.
●Variations in monthly mean sea level are dominated by the effect of the 1997/1998 El Niño, with a very small seasonal cycle.
●Variations in monthly mean air and water temperature are likewise dominated by the effect of the 1997/1998 El Niño, with very small seasonal cycles.
●The equatorial location of Tarawa means that it is not subject to tropical cyclones.
●The tsunami caused by the Peru earthquake of June 2001, which registered strongly on many Pacific SEAFRAME gauges, was negligible at Tarawa.

Dear Pacific Island Government Representative
Welcome to the first Pacific Country Report, containing a summary of the sea level, climate, oceanography and extreme events for each of the twelve SEAFRAME monitoring sites, plus Palau and Niue. We intend to produce them to coincide with the Forum Meetings.
Your feedback is essential to ensure that improvements are made, that what is important to you is addressed and explained. Your feedback will help guide the frequency of publishing and distribution. We invite you to give us both positive and negative feedback (your comments will remain confidential) because what might be obvious to you might be overlooked by scientists.
You can tear out this page, jot notes on it, and mail or fax it to us at the address above. Or you can email comments to us. A few words is all we need.
1-Did you find it informative?
2-What significant information have we omitted?
3-Would you like to see additional emphasis on any topic? If so, what?
4-Would you like more explanation on any topic? If so, what?
5-Any other suggestions or constructive criticism?
Name (optional)
Country
Thank you for your time!
Introduction
As part of the AusAID-sponsored South Pacific Sea Level and Climate Monitoring Project (“Pacific Project”) for the FORUM region, in response to concerns raised by its member countries over the potential impacts of an enhanced Greenhouse Effect on climate and sea levels in the South Pacific region, a SEAFRAME (Sea Level Fine Resolution Acoustic Measuring Equipment) gauge was installed in Betio, Tarawa,
Kiribati, in December, 1992. The gauge has been returning high resolution, good scientific quality data since installation.
SEAFRAME gauges not only measure sea level by two independent means, but also a number of “ancillary” variables - air and water temperatures, wind speed, wind direction and atmospheric pressure. There is an associated programme of levelling to “first order”, to determine vertical movement of the sea level sensors due to local land movement. Continuous Global Positioning System (CGPS) measurements are now also being made to determine the vertical movement of the land with respect to the International Terrestrial Reference Frame.
When change in sea level is measured with a tide gauge over a number of years one cannot be sure whether the sea is rising or the land is sinking. Tide gauges measure relative sea level change, i.e., the change in sea level relative to the tide gauge, which is connected to the land. To local people, the relative sea level change is of paramount importance. Vertical movement of the land can have a number of causes, e.g. island uplift, compaction of sediment or withdrawal of ground water. From the standpoint of global change it is imperative to establish absolute sea level change, i.e. sea level referenced to the centre of the Earth which is to say in the terrestrial reference frame.
In order to accomplish this the vertical land movement and in particular the rate at which the land moves must be measured separately. This is the reason for the addition of CGPS near the tide gauges.
June-2002
Regional Overview
Variations in sea level and atmosphere are inextricably linked. For example, to understand why the sea level at Tuvalu undergoes a much larger annual fluctuation than at Samoa, we must study the seasonal shifts of the trade winds. On the other hand, the climate of the Pacific Island region is entirely ocean-dependent. When the warm waters of the western equatorial Pacific flow east during El Niño, the rainfall, in a sense, goes with them, leaving the islands in the west in drought.
Compared to higher latitudes, air temperatures in the tropics vary little throughout the year. Of the SEAFRAME sites, the most extreme changes are naturally experienced by those furthest from the equator – the Cook Islands (at 21°S) recorded the lowest temperature, 13.1°C, in August 1998. The Cook Islands regularly fall to 16°C while Tonga (also at 21°S) regularly falls to 18°C in winter (July/August).
SEAFRAME location |
Minimum recorded |
Maximum recorded |
|
air temperature |
air temperature |
|
(°C) |
(°C) |
Cook Islands |
13.1 |
32.0 |
Tonga |
16.0 |
31.4 |
Fiji (Lautoka) |
16.6 |
33.4 |
Vanuatu |
16.5 |
33.3 |
Samoa |
18.7 |
32.1 |
Tuvalu |
22.8 |
31.6 |
Kiribati |
22.4 |
32.9 |
Nauru |
22.4 |
32.4 |
Solomon Islands |
20.1 |
34.5 |
Papua New Guinea |
21.5 |
31.1 |
Marshall Islands |
20.5 |
31.9 |
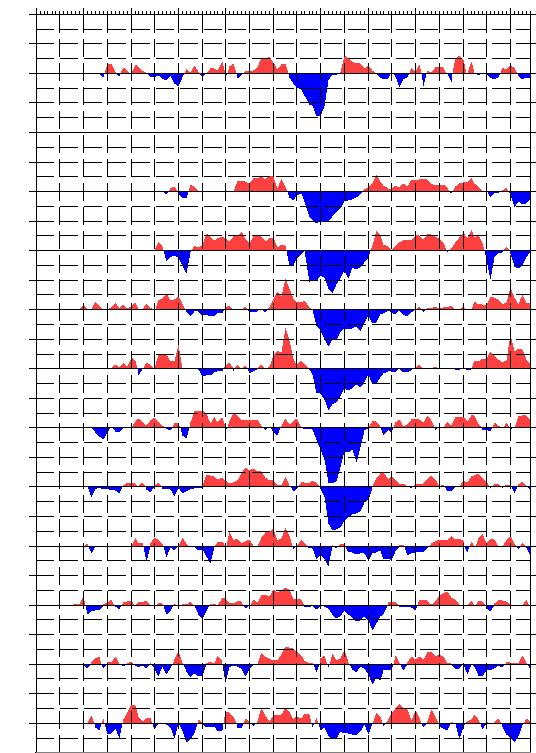
The most striking oceanic and climate fluctuations in the equatorial region are not the seasonal, but interannual changes associated with El Niño. These affect virtually every aspect of the system, including sea level, winds, precipitation, and air and water temperature. Referring to the plot below, we see that at most SEAFRAME sites, the lowest recorded sea levels appear during the 1997/1998 El Niño. The most dramatic effects were observed at the Marshall Islands, PNG, Nauru, Tuvalu and Kiribati, and along a band extending southeastward from PNG to Samoa. The latter band corresponds to a zone meteorologists call the “Sub-Tropical Convergence Zone” or STCZ. In the figure below, we see the effect of the 1997/1998 El Niño on all SEAFRAME stations.
June-2002
4.8
4.6
4.4
4.2
4.0
3.8
3.6
3.4
3.2
3.0
2.8
2.6
2.4
2.2
2.0
1.8
1.6
1.4
1.2
1.0
0.8
0.6
0.4
0.2
0.0
-0.2
1992 1993 1994 1995 1996 1997 1998 1999 2000 2001
* Plotted values are sea level “anomalies” (tides and trend removed from data).
June-2002
Most Pacific Islanders are very aware that the sea level is controlled by many factors, some periodic (likes the tides), some brief but violent (like cyclones), and some prolonged (like El Niño), because of the direct effect the changes have upon their lives. The effects vary widely across the region. Along the Melanesian archipelago, from Manus Island to Vanuatu, tides are predominantly diurnal, or once daily, while elsewhere the tide tends to have two highs and two lows each day. Cyclones, which are fueled by heat stored in the upper ocean, tend to occur in the hottest month. They do not occur within 5° of the equator due to the weakness of the “Coriolis Force”, a rather subtle effect of the earth’s rotation. El Niño’s impact on sea level is mostly felt along the STCZ, because of changes in the strength and position of the Trade Winds, which have a direct bearing on sea level, and along the equator, due to related changes in ocean currents. Outside these regions, sea levels are influenced by El Niño, but to a far lesser degree.
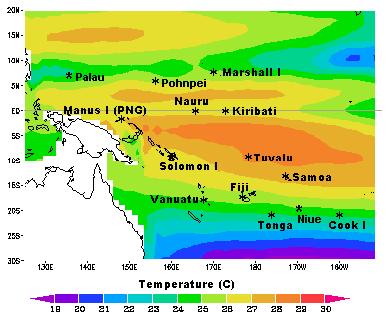
Mean Surface Water Temperature
Note the warm temperatures in the STCZ and just north of the equator.
The convergence of the Trade Winds along the STCZ has the effect of deepening the warm upper layer of the ocean, which affects the seasonal sea level. Tuvalu, which is in the heart of the STCZ, normally experiences higher-than-average sea levels early each year when this effect is at its peak. At Samoa, the convergence is weaker, and the seasonal variation of sea level is far less, despite the fact that the water temperature recorded by the gauge varies in a similar fashion. The interaction of wind, solar heating of the oceanic upper layer, and sea level, is quite complex and frequently leads to unexpected consequences.
June-2002
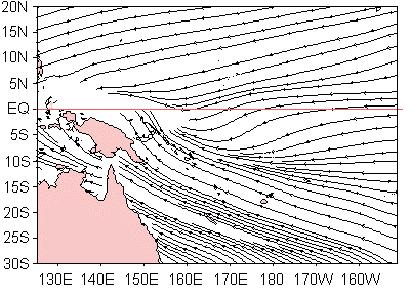
The plot Streamlines of Mean Surface Wind shows how the region is dominated by easterly trade winds. In the Southern Hemisphere the Trades blow to the northwest and in the Northern Hemisphere they blow to the southwest. The streamlines converge, or crowd together, along the STCZ.
Streamlines of Mean Surface Wind
Much of the Melanesian subregion is also influenced by the Southeast Asian Monsoon. The strength and timing varies considerably, but at Manus Island (PNG), for example, the NW monsoon season (winds from the northwest) runs from November to March, while the SE monsoon brings wind (also known as the Southeast Trade Winds) from
May to October. Unlike many monsoon-dominated areas, the rainfall at Manus Island is distributed evenly throughout the year (in normal years).
Mean Sea Level Trends and their Confidence Intervals
With the great diversity in climatic environments, vertical land movement and ocean variability, one might expect that that the sea level trends measured at different stations over the limited period for which tide gauge data has been collected may also vary. That this is indeed the case is demonstrated by the following table, which contains the relative sea level trends from all the regional stations for which at least 25 years of hourly data was available.
June-2002
Location |
Country |
|
Years of |
Trend |
Standard |
|
|
|
data |
(mm/year) |
Deviation |
|
|
|
|
|
mm/year |
Pago Pago |
U S Trust |
|
49.7 |
+1.43 |
1.5 |
Rarotonga |
Cook Is |
|
22.2 |
+3.80 |
3.7 |
Penrhyn |
Cook Is |
|
21.6 |
+0.89 |
3.4 |
Pohnpei |
F S of Micronesia |
|
26.9 |
+0.42 |
3.7 |
Kapingamarangi |
F S of Micronesia |
|
19.9 |
-1.04 |
4.7 |
Truk |
F S of Micronesia |
|
27.6 |
+1.79 |
3.3 |
Guam |
U S Trust |
|
50.1 |
+0.37 |
1.9 |
Yap |
F S of Micronesia |
|
30.9 |
-0.20 |
3.6 |
Suva |
Fiji |
|
24.8 |
+3.99 |
3.0 |
Christmas |
Rep of Kiribati |
|
40.3 |
-0.68 |
2.2 |
Kanton |
Rep of Kiribati |
|
45.0 |
+0.26 |
1.5 |
Fanning |
Rep of Kiribati |
|
16.8 |
+2.17 |
5.1 |
Tarawa |
Rep of Kiribati |
|
23.6 |
-2.24 |
3.6 |
Majuro |
Rep of Marshall Is |
|
30.8 |
+2.79 |
2.6 |
Enewetok |
Rep of Marshall Is |
|
24.5 |
+1.18 |
3.3 |
Kwajalein |
Rep of Marshall Is |
|
54.4 |
+1.13 |
1.3 |
Nauru |
Rep of Nauru |
|
24.2 |
-2.03 |
4.2 |
Malakal |
Rep of Palau |
|
30.1 |
+0.64 |
4.0 |
Honiara |
Solomon Is |
|
24.5 |
-2.21 |
4.8 |
Nuku’alofa |
Tonga |
|
9.4 |
+4.90 |
7.2 |
Funafuti |
Tuvalu |
|
21.6 |
+0.92 |
5.1 |
Port Vila |
Vanuatu |
|
11.3 |
+6.21 |
6.8 |
Mean trend: 1.11 mm/year (all data) |
Mean trend of data > 25 years: 0.8 mm/year |
|
Data from University of Hawaii as at June 2002 |
|
The following plot depicts the evolution of the short term sea level trends, at SEAFRAME stations, from one year after installation to the present. Please note that the trendlines have not yet stabilised.
June-2002
Short Term Sea Level Trends (mm/year)
1992 1993 1994 1995 1996 1997 1998 1999 2000 2001 2002
Fiji
Vanuatu
Tonga
Cook Islands
Samoa
Marshall Islands
Kiribati
Tuvalu
Nauru
Solomon Islands
Papua New Guinea
Federated States of Micronesia New site installed December 2001: 12 months of data needed for trend
0
0
0
0
0
0
0
0
0
0
0
+25
0 -25
Dec Jun Dec Jun Dec Jun Dec Jun Dec Jun Dec Jun Dec Jun Dec Jun Dec Jun Dec Jun Dec Jun
1992 1993 1994 1995 1996 1997 1998 1999 2000 2001 2002
June-2002
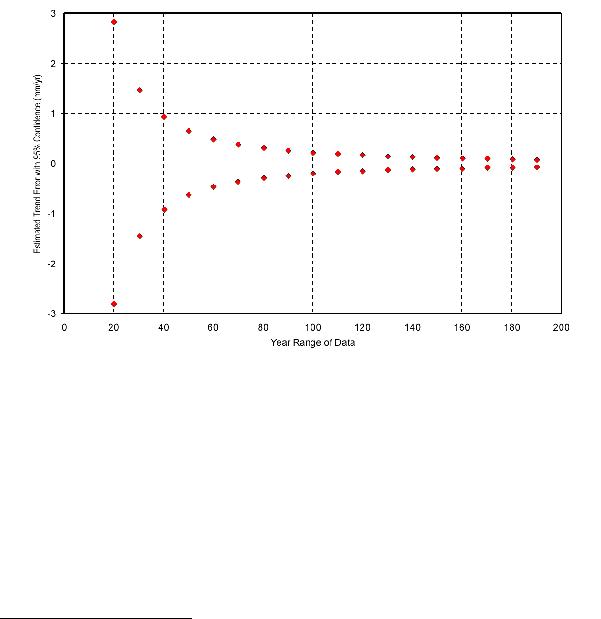
The expected width of the 95% confidence interval (±1.96 times the standard error) as a function of data length based on the relationship for all National Oceanographic and Atmospheric Administration (NOAA) gauges with a data record of at least 25 years are shown in the figure below. A confidence interval or precision of 1 mm/year should be obtainable at most stations with 50-60 years of data on average, providing there is no acceleration in sea level change, vertical motion of the tide gauge, or abrupt shifts in trend due to tectonic events. In the figure, the 95% confidence intervals are plotted as a function of the year range of data, based on NOAA tide gauges with at least 25 years of record1.
95% Confidence Intervals for Linear Mean Sea Level trends (mm/year)
This overview was intended to provide an introduction to the Pacific Islands regional climate, in particular those aspects that are related to sea level. This is an area of active research, and many elements, such as interdecadal oscillations, are only beginning to be appreciated. The individual country reports give greater detail on the variations experienced at the twelve SEAFRAME sites in the Pacific.
1. Zervas, C. (2001) Sea Level Variations of the United States 1854-1999. NOAA, USA. June-2002
Project findings to date - Kiribati
Short-term sea level trend
A fundamental goal of the Project is to establish the rate of sea level change. It has been recognised since the beginning that this would require several decades of continuous, high quality data. However, in response to increasing requests from the region for information regarding the trends as they gradually emerge from the background “noise”, combined with concern that less experienced users might attempt to fit a trend line to the data without properly accounting for processes such as seasonality that can bias the result, the preliminary findings are now being provided.
These are given in the form of plots (see Short Term Sea Level Trends above) which show how the trend develops as more data becomes available. We caution against drawing conclusions prematurely.
As at June 2002, based on the short-term sea level trend analyses performed by the
National Tidal Facility Australia of the nearly nine years of Tarawa data, a rate of +0.1 mm per year has been observed (as compared to the global average, published in the
Third Assessment Report of the Intergovernmental Panel on Climate Change, of around +1 or +2 mm per year). The Short Term Sea Level Trends plot shows how the trend estimate has varied over time, and because the data set is still relatively short, still varies considerably from month to month. In the early years, the trend appeared to indicate an enormous rate of sea level rise. Later, due to the 1997/1998 El Niño when sea level fell 25 cm below average, the trend actually went negative, and remained so for the next three years. Over most of the past four years, the sea level appears to have been falling. Only in 2002 has the trend returned to positive values. It is still far too early to deduce a long-term trend (or even whether it will be positive or negative) from this data.
June-2002
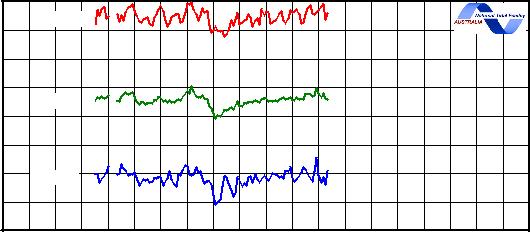
The sea level data recorded since installation is summarised in the following plot. The middle curve (green) represents the monthly mean sea level. The upper and lower curves show the highest and lowest values recorded each month. We see that largely, the monthly mean values are quite stable throughout the year, with the exception of 1997 and 1998, where the level fluctuates during the El Niño.
Seasonal cycles are weak. There is normally about a two metre difference between the highest and lowest recorded levels in a given month, a relatively limited range in comparison to many sites. The red curve (highest value for the month) in the figure is the most variable of the three. This relates to the oceanography of the Kiribati region, which is subject to the occasional passage of large-scale equatorial waves. The waves, which are generated by westerly winds on the equator, create large-scale disturbances of the sea surface. These then travel eastwards, temporarily raising the sea surface by several tens of centimetres as they pass. The passage of these waves is most active in the early stages of an El Niño event.
Monthly sea level at Betio
SEAFRAME gauge
|
3 |
|
|
|
|
|
|
|
|
|
|
|
|
|
|
|
|
|
|
|
|
|
2.6 |
Maximum |
|
|
|
|
|
|
|
|
|
|
|
|
|
|
|
|
|
|
|
|
|
|
|
|
|
|
|
|
|
|
|
|
|
|
|
|
|
|
(metres) |
2.2 |
|
|
|
|
|
|
|
|
|
|
|
|
|
|
|
|
|
|
|
|
1.8 |
|
|
|
|
|
|
|
|
|
|
|
|
|
|
|
|
|
|
|
|
|
Mean |
|
|
|
|
|
|
|
|
|
|
|
|
|
|
|
|
|
|
Level |
1.4 |
|
|
|
|
|
|
|
|
|
|
|
|
|
|
|
|
|
|
|
|
1 |
|
|
|
|
|
|
|
|
|
|
|
|
|
|
|
|
|
|
|
|
Sea |
0.6 |
Minimum |
|
|
|
|
|
|
|
|
|
|
|
|
|
|
|
|
|
|
0.2 |
|
|
|
|
|
|
|
|
|
|
|
|
|
|
|
|
|
|
|
|
|
-0.2 |
|
|
|
|
|
|
|
|
|
|
|
|
|
|
|
|
|
|
|
|
|
1990 |
1991 |
1992 |
1993 |
1994 |
1995 |
1996 |
1997 |
1998 |
1999 |
2000 |
2001 |
2002 |
2003 |
2004 |
2005 |
2006 |
2007 |
2008 |
2009 |
2010 |
|
|
|
|
|
|
|
|
|
|
|
Year |
|
|
|
|
|
|
|
|
|
|
The mean sea level over the period was 1.623 metres, with a maximum of 2.98 metres in March 1997, and a minimum of 0.17 metres in February 1998.
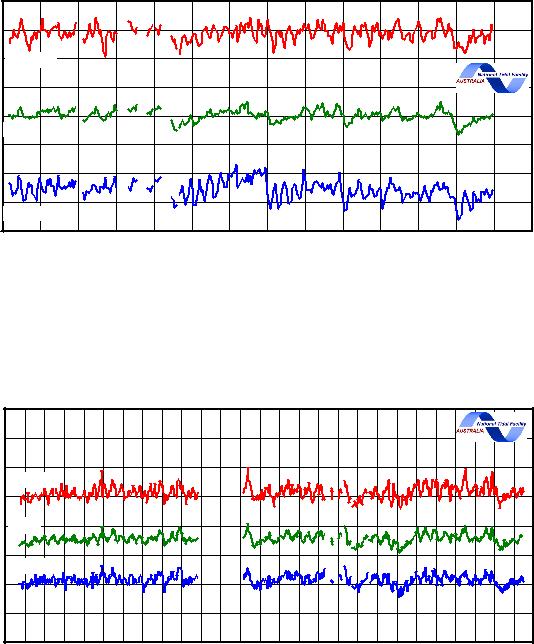
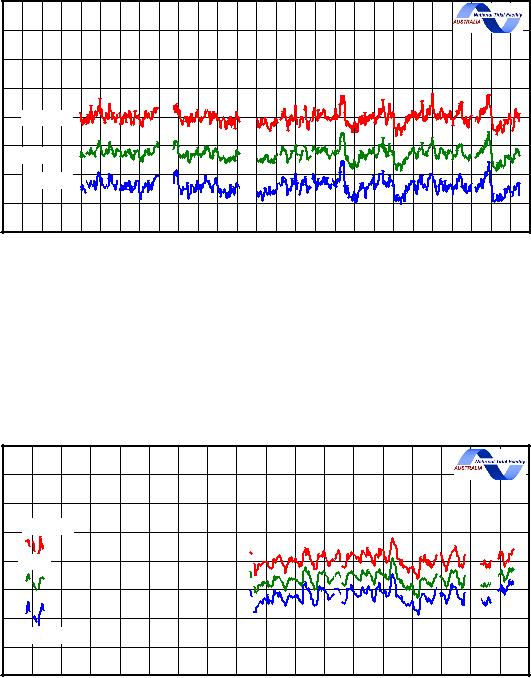
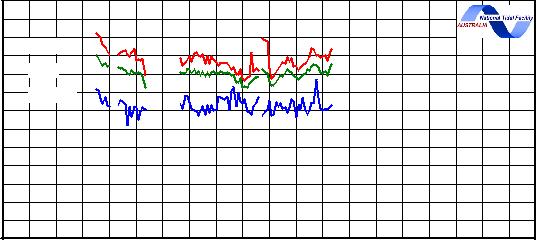
Historical Sea Level Trend Assessment
Longer sea level records are available at Kiribati, from gauges operated by the University of Hawaii (UH) at Tarawa, Kanton, Kiritimati, and Fanning. Records of hourly tide gauge data were kept for about 24, 45, 40, and 17 years respectively. The respective overall trends were –2.24, +0.26, -0.68 and +2.17 mm/year, (as compared to the global average of 1 – 2 mm/year).
June-2002
Monthly sea level at Tarawa
University of Hawaii data
|
3.2 |
|
|
|
|
|
|
|
|
|
|
|
|
|
|
|
|
2.8 |
|
|
|
|
|
|
|
|
|
|
|
|
|
|
|
(metres) |
2.4 |
Maximum |
|
|
|
|
|
|
|
|
|
|
|
|
|
2 |
|
|
|
|
|
|
|
|
|
|
|
|
|
|
|
|
|
|
|
|
|
|
|
|
|
|
|
|
|
|
|
Level |
1.6 |
Mean |
|
|
|
|
|
|
|
|
|
|
|
|
|
|
|
|
|
|
|
|
|
|
|
|
|
|
|
|
|
1.2 |
|
|
|
|
|
|
|
|
|
|
|
|
|
|
|
Sea |
0.8 |
|
|
|
|
|
|
|
|
|
|
|
|
|
|
|
|
|
|
|
|
|
|
|
|
|
|
|
|
|
|
|
|
0.4 |
Minimum |
|
|
|
|
|
|
|
|
|
|
|
|
|
|
|
|
|
|
|
|
|
|
|
|
|
|
|
|
|
0 |
|
|
|
|
|
|
|
|
|
|
|
|
|
|
|
|
1974 |
1976 |
1978 |
1980 |
1982 |
1984 |
1986 |
1988 |
1990 |
1992 |
1994 |
1996 |
1998 |
2000 |
2002 |
|
|
|
|
|
|
|
|
|
Year |
|
|
|
|
|
|
|
Monthly sea level at Kanton
University of Hawaii data
|
2.8 |
|
|
|
|
|
|
|
|
|
|
|
|
|
|
|
|
|
|
|
|
|
|
|
|
|
|
|
|
|
2.4 |
|
|
|
|
|
|
|
|
|
|
|
|
|
|
|
|
|
|
|
|
|
|
|
|
|
|
|
|
(metres) |
2 |
Maximum |
|
|
|
|
|
|
|
|
|
|
|
|
|
|
|
|
|
|
|
|
|
|
|
|
|
|
|
|
|
|
|
|
|
|
|
|
|
|
|
|
|
|
|
|
|
|
|
|
|
|
|
1.6 |
|
|
|
|
|
|
|
|
|
|
|
|
|
|
|
|
|
|
|
|
|
|
|
|
|
|
|
|
|
Mean |
|
|
|
|
|
|
|
|
|
|
|
|
|
|
|
|
|
|
|
|
|
|
|
|
|
|
Level |
1.2 |
|
|
|
|
|
|
|
|
|
|
|
|
|
|
|
|
|
|
|
|
|
|
|
|
|
|
0.8 |
Minimum |
|
|
|
|
|
|
|
|
|
|
|
|
|
|
|
|
|
|
|
|
|
|
|
|
|
Sea |
|
|
|
|
|
|
|
|
|
|
|
|
|
|
|
|
|
|
|
|
|
|
|
|
|
|
0.4 |
|
|
|
|
|
|
|
|
|
|
|
|
|
|
|
|
|
|
|
|
|
|
|
|
|
|
|
|
|
0 |
|
|
|
|
|
|
|
|
|
|
|
|
|
|
|
|
|
|
|
|
|
|
|
|
|
|
|
|
|
-0.4 |
|
|
|
|
|
|
|
|
|
|
|
|
|
|
|
|
|
|
|
|
|
|
|
|
|
|
|
|
|
1948 |
1950 |
1952 |
1954 |
1956 |
1958 |
1960 |
1962 |
1964 |
1966 |
1968 |
1970 |
1972 |
1974 |
1976 |
1978 |
1980 |
1982 |
1984 |
1986 |
1988 |
1990 |
1992 |
1994 |
1996 |
1998 |
2000 |
2002 |
|
|
|
|
|
|
|
|
|
|
|
|
|
|
|
Year |
|
|
|
|
|
|
|
|
|
|
|
|
|
June-2002
Monthly sea level at Kiritimati Island
University of Hawaii data
|
2.8 |
|
|
2.4 |
|
(metres) |
2 |
|
1.6 |
|
|
Maximum |
Level |
1.2 |
0.8 |
Mean |
Sea |
|
0.4 |
Minimum |
|
|
0 |
|
|
-0.4 |
|
|
1948 1950 1952 1954 1956 1958 1960 1962 1964 1966 1968 1970 1972 1974 1976 1978 1980 1982 1984 1986 1988 1990 1992 1994 1996 1998 2000 2002 |
Year
Monthly sea level at Fanning
University of Hawaii data
|
2.8 |
|
|
|
|
|
|
|
|
|
|
|
|
|
|
|
|
|
|
|
2.4 |
|
|
|
|
|
|
|
|
|
|
|
|
|
|
|
|
|
|
(metres) |
2 |
|
|
|
|
|
|
|
|
|
|
|
|
|
|
|
|
|
|
1.6 |
Maximum |
|
|
|
|
|
|
|
|
|
|
|
|
|
|
|
|
|
|
|
|
|
|
|
|
|
|
|
|
|
|
|
|
|
|
|
Mean |
|
|
|
|
|
|
|
|
|
|
|
|
|
|
|
|
|
Level |
1.2 |
|
|
|
|
|
|
|
|
|
|
|
|
|
|
|
|
|
0.8 |
|
|
|
|
|
|
|
|
|
|
|
|
|
|
|
|
|
|
Sea |
0.4 |
|
|
|
|
|
|
|
|
|
|
|
|
|
|
|
|
|
|
|
Minimum |
|
|
|
|
|
|
|
|
|
|
|
|
|
|
|
|
|
|
|
|
|
|
|
|
|
|
|
|
|
|
|
|
|
|
|
0 |
|
|
|
|
|
|
|
|
|
|
|
|
|
|
|
|
|
|
|
-0.4 |
|
|
|
|
|
|
|
|
|
|
|
|
|
|
|
|
|
|
|
1956 |
1958 |
1960 |
1962 |
1964 |
1966 |
1968 |
1970 |
1972 |
1974 |
1976 |
1978 |
1980 |
1982 |
1984 |
1986 |
1988 |
1990 |
1992 |
|
|
|
|
|
|
|
|
|
|
Year |
|
|
|
|
|
|
|
|
|
|
|
|
|
|
|
|
|
|
June-2002 |
|
|
|
|
|
|
|
|
|
|
|
|
|
|
|
|
|
|
12 |
|
|
|
|
|
|
|
|
|
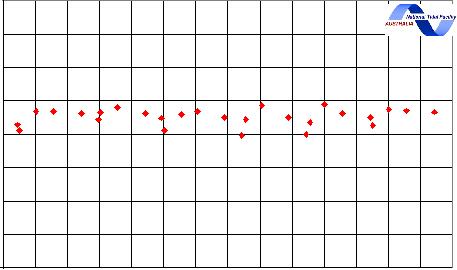
Predicted highest astronomical tide
The component of sea level that is predictable due to the influence of the Sun and the Moon and some seasonal effects allow us to calculate the highest predictable level each year. It is primarily due to the ellipticity of the orbit of the Earth around the Sun, and that of the Moon around the Earth resulting in a point at which the Earth is closest to the Sun, combined with a spring tide in the usual 28 day orbit of the Moon around the
Earth. The figure shows that the highest predicted level (2.9 m) over the period 1990 to 2016 will be reached at 17:33 Local Time on the 31 October 2010.
Predicted highest tide each year for Betio
3.2
3.1
3
2.9
2.8
2.7
2.6
2.5
2.4 |
|
|
|
|
|
|
|
|
|
|
|
|
|
|
1990 |
1992 |
1994 |
1996 |
1998 |
2000 |
2002 |
2004 |
2006 |
2008 |
2010 |
2012 |
2014 |
2016 |
2018 |
Year
The location of the gauge within the atoll lagoon leads to unique characteristics showing up in the data, such as the effect of solar heating of the lagoon waters. It also shelters the gauge from ocean wave swell, particularly from the east. Swell is caused by surface winds. It is an important source of error in many tide gauges, especially the older conventional gauges with stilling wells.
June-2002
Monthly means of air temperature, water temperature and atmospheric pressure
The mean air temperatures at Tarawa have undergone annual fluctuations since the 1997/1998 El Niño, with highest temperatures appearing in September and October. The range is not large, generally having only 4°-6°C separating the highest and lowest temperatures recorded each year. The mean air temperature was 28°C. The highest recorded air temperature was 32.9°C in September 1999, and the minimum was 22.4°C in September 1994. Data was interrupted for over a year, beginning in 1995, due to a combination of power failures at Tarawa and a technical fault with the air thermometer.
Monthly air temperature at Betio
SEAFRAME gauge
|
36 |
|
|
|
|
|
|
|
|
|
|
|
|
|
|
|
|
|
|
|
|
|
34 |
|
|
|
|
|
|
|
|
|
|
|
|
|
|
|
|
|
|
|
|
C) |
32 |
Maximum |
|
|
|
|
|
|
|
|
|
|
|
|
|
|
|
|
|
30 |
|
|
|
|
|
|
|
|
|
|
|
|
|
|
|
|
|
(deg |
|
|
|
|
|
|
|
|
|
|
|
|
|
|
|
|
|
|
|
|
28 |
Mean |
|
|
|
|
|
|
|
|
|
|
|
|
|
|
|
|
|
|
|
|
|
|
|
|
|
|
|
|
|
|
|
|
|
|
|
|
|
|
|
Minimum |
|
|
|
|
|
|
|
|
|
|
|
|
|
|
|
|
|
|
temperature |
26 |
|
|
|
|
|
|
|
|
|
|
|
|
|
|
|
|
|
|
24 |
|
|
|
|
|
|
|
|
|
|
|
|
|
|
|
|
|
|
|
|
22 |
|
|
|
|
|
|
|
|
|
|
|
|
|
|
|
|
|
|
|
|
20 |
|
|
|
|
|
|
|
|
|
|
|
|
|
|
|
|
|
|
|
|
18 |
|
|
|
|
|
|
|
|
|
|
|
|
|
|
|
|
|
|
|
|
16 |
|
|
|
|
|
|
|
|
|
|
|
|
|
|
|
|
|
|
|
|
Air |
|
|
|
|
|
|
|
|
|
|
|
|
|
|
|
|
|
|
|
|
14 |
|
|
|
|
|
|
|
|
|
|
|
|
|
|
|
|
|
|
|
|
|
|
|
|
|
|
|
|
|
|
|
|
|
|
|
|
|
|
|
|
|
|
12 |
|
|
|
|
|
|
|
|
|
|
|
|
|
|
|
|
|
|
|
|
|
10 |
|
|
|
|
|
|
|
|
|
|
|
|
|
|
|
|
|
|
|
|
|
1990 |
1991 |
1992 |
1993 |
1994 |
1995 |
1996 |
1997 |
1998 |
1999 |
2000 |
2001 |
2002 |
2003 |
2004 |
2005 |
2006 |
2007 |
2008 |
2009 |
2010 |
|
|
|
|
|
|
|
|
|
|
|
Year |
|
|
|
|
|
|
|
|
|
|
The annual change in water temperature at Tarawa has about half the range seen in air temperature. The mean water temperature was 29.5°C. The highest recorded water temperature was 33.4°C in November 1997, and the minimum was 26.2°C in February
1998. Very large water (but not air) temperature fluctuations marked the start of the 1997/1998 El Niño. As with the sea level changes at the time, the water temperatures varied with the passage of large scale, eastward-travelling equatorial waves.
June-2002
Monthly water temperature at Betio
SEAFRAME gauge
|
34 |
|
|
|
|
|
|
|
|
|
|
|
|
|
|
|
|
|
|
|
|
C) |
32 |
Maximum |
|
|
|
|
|
|
|
|
|
|
|
|
|
|
|
|
|
(deg |
|
|
|
|
|
|
|
|
|
|
|
|
|
|
|
|
|
|
30 |
Mean |
|
|
|
|
|
|
|
|
|
|
|
|
|
|
|
|
|
|
|
|
|
|
|
|
|
|
|
|
|
|
|
|
|
|
|
|
|
|
|
temperature |
28 |
Minimum |
|
|
|
|
|
|
|
|
|
|
|
|
|
|
|
|
|
|
|
|
|
|
|
|
|
|
|
|
|
|
|
|
|
|
|
|
|
|
26 |
|
|
|
|
|
|
|
|
|
|
|
|
|
|
|
|
|
|
|
|
24 |
|
|
|
|
|
|
|
|
|
|
|
|
|
|
|
|
|
|
|
|
Water |
|
|
|
|
|
|
|
|
|
|
|
|
|
|
|
|
|
|
|
|
22 |
|
|
|
|
|
|
|
|
|
|
|
|
|
|
|
|
|
|
|
|
|
|
|
|
|
|
|
|
|
|
|
|
|
|
|
|
|
|
|
|
|
|
20 |
|
|
|
|
|
|
|
|
|
|
|
|
|
|
|
|
|
|
|
|
|
1990 |
1991 |
1992 |
1993 |
1994 |
1995 |
1996 |
1997 |
1998 |
1999 |
2000 |
2001 |
2002 |
2003 |
2004 |
2005 |
2006 |
2007 |
2008 |
2009 |
2010 |
|
|
|
|
|
|
|
|
|
|
|
Year |
|
|
|
|
|
|
|
|
|
|
The monthly atmospheric pressure at Tarawa shows a decline in the years after the El Niño of 1998. The highest pressure recorded was 1015 hPa in November 1997, while the lowest was 999.6 hPa in February 2001.
Monthly atmospheric pressure at Betio
SEAFRAME gauge
|
1030 |
|
|
|
|
|
|
|
|
|
|
|
|
|
|
|
|
|
|
|
|
(hPa) |
1020 |
|
|
|
|
|
|
|
|
|
|
|
|
|
|
|
|
|
|
|
|
|
Maximum |
|
|
|
|
|
|
|
|
|
|
|
|
|
|
|
|
|
|
pressure |
1010 |
|
|
|
|
|
|
|
|
|
|
|
|
|
|
|
|
|
|
Mean |
|
|
|
|
|
|
|
|
|
|
|
|
|
|
|
|
|
|
|
|
|
|
|
|
|
|
|
|
|
|
|
|
|
|
|
|
|
1000 |
Minimum |
|
|
|
|
|
|
|
|
|
|
|
|
|
|
|
|
|
|
|
|
|
|
|
|
|
|
|
|
|
|
|
|
|
|
|
|
|
|
|
|
|
|
|
|
|
|
|
|
|
|
|
|
|
|
|
|
|
|
|
Atmospheric |
990 |
|
|
|
|
|
|
|
|
|
|
|
|
|
|
|
|
|
|
|
|
980 |
|
|
|
|
|
|
|
|
|
|
|
|
|
|
|
|
|
|
|
|
970 |
|
|
|
|
|
|
|
|
|
|
|
|
|
|
|
|
|
|
|
|
|
|
|
|
|
|
|
|
|
|
|
|
|
|
|
|
|
|
|
|
|
|
960 |
|
|
|
|
|
|
|
|
|
|
|
|
|
|
|
|
|
|
|
|
|
1990 |
1991 |
1992 |
1993 |
1994 |
1995 |
1996 |
1997 |
1998 |
1999 |
2000 |
2001 |
2002 |
2003 |
2004 |
2005 |
2006 |
2007 |
2008 |
2009 |
2010 |
|
|
|
|
|
|
|
|
|
|
Year |
|
|
|
|
|
|
|
|
|
|
|
|
|
|
|
|
|
|
|
June-2002 |
|
|
|
|
|
|
|
|
|
|
|
|
|
|
|
|
|
|
|
|
15 |
|
|
|
|
|
|
|
|
|
|
|
Extreme Events
Kiribati, being within 3° of the equator, is not subject to cyclones. During the period since the SEAFRAME installation, there have been no detectable tsunami-generated waves.
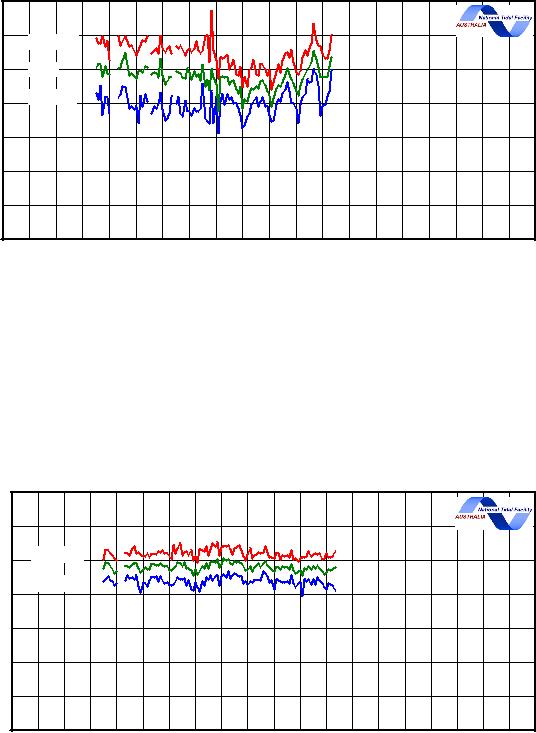
Tsunami records
A tsunami can be defined as "A wave usually generated by seismic activity. Also called seismic sea wave, or, incorrectly, a tidal wave. Barely discernible in the open ocean, their amplitude may increase to over ten metres in the shallow coastal regions. Tsunamis are most common in the Pacific Ocean."
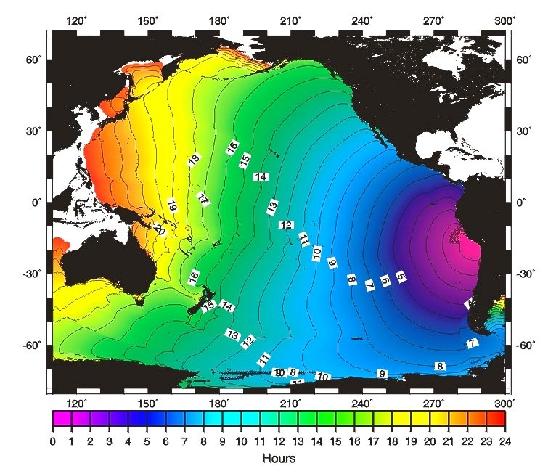
Despite recent history, Tarawa is not immune from potential problems should there be a large tsunami-generating undersea earthquake in the vicinity. The following plots show how, many hours after the initial earthquake, tsunamis can generate large disturbances in coastal locations.
Travel Times for Tsunami Wave from Peru Earthquake
June-2002
Tsunami Wave due to Peru Earthquake (simulated magnitude)
Definition of Datum and other Geodetic Levels at Tarawa
Newcomers to the study of sea level are confronted by bewildering references to “Chart Datum”, “Tide Staff Zero”, and other specialised terms. Frequently asked questions are,
“how do NTFA sea levels relate to the depths on the marine chart?” and “how do the UH sea levels relate to NTFA’s?”.
Regular surveys to a set of coastal benchmarks are essential. If a SEAFRAME gauge or the wharf to which it fixed were to be damaged and needed replacement, the survey history would enable the data record to be “spliced across” the gap, thereby preserving the entire invaluable record from start to finish.
June-2002
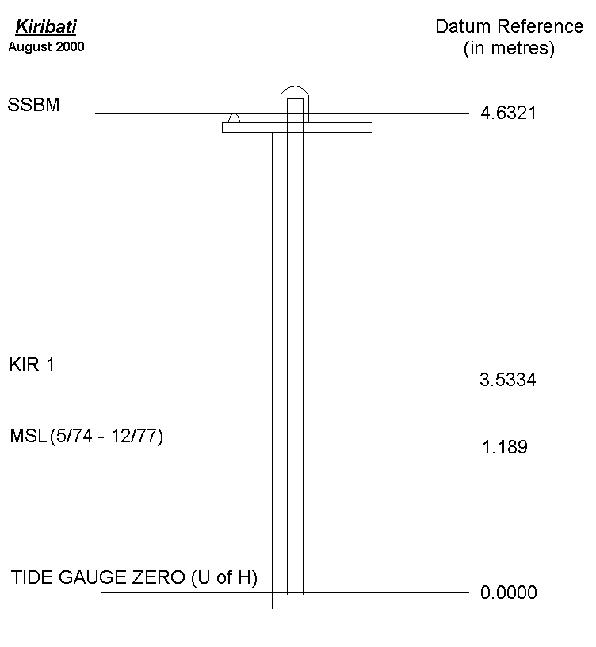
The word “datum” in relation to tide gauges and nautical charts means a reference level. Similarly, when you measure the height of a child, your datum is the floor on which the child stands.
“Sea levels” in the NTFA data are normally reported relative to “Chart Datum” (CD), thus enabling users to relate the NTFA data directly to depth soundings shown on marine charts – if the NTFA sea level is +1.5 metres, an additional 1.5 metres of water may be added to the chart depths. Unfortunately, at Tarawa the original benchmark used for the marine surveys is unrecoverable, so it is not possible to place CD on this chart. In the absence of a known CD, NTFA has chosen to refer sea level to the older UH datum, or “Tide Staff Zero”. With this choice, the Mean Sea Level of either data set is close (though not necessarily identical).
Mean Sea Level (MSL) in the figure is the average recorded level at the gauge over the three and a half year period 1974/1977 (as indicated). The 1974/1977 MSL at Tarawa was 1.189 metres above the UH Tide Staff Zero (and the SEAFRAME zero level).
June-2002


 Dec Jun Dec Jun Dec Jun Dec Jun Dec Jun Dec Jun Dec Jun Dec Jun Dec Jun Dec Jun Dec