Transcript of Dr. James Hansen's testimony before the U.S. Senate Committee on Energy and Natural Resources on June 23, 1988.
Three pdf-format versions of Dr. Hansen's testimony can be found here:
https://sealevel.info/Hansen.0623-1988_oral.pdf
https://pulitzercenter.org/sites/default/files/june_23_1988_senate_hearing_1.pdf
https://sealevel.info/1988_Hansen_Senate_Testimony.pdf
https://sealevel.info/hansen1988_retrospective.html
https://sealevel.info/1988-07-07_Hansen_House_Testimony.pdf
https://sealevel.info/1987-11-09_Hansen_Senate_Testimony.pdf
https://pulitzercenter.org/sites/default/files/may_8_1989_senate_hearing_0.pdf
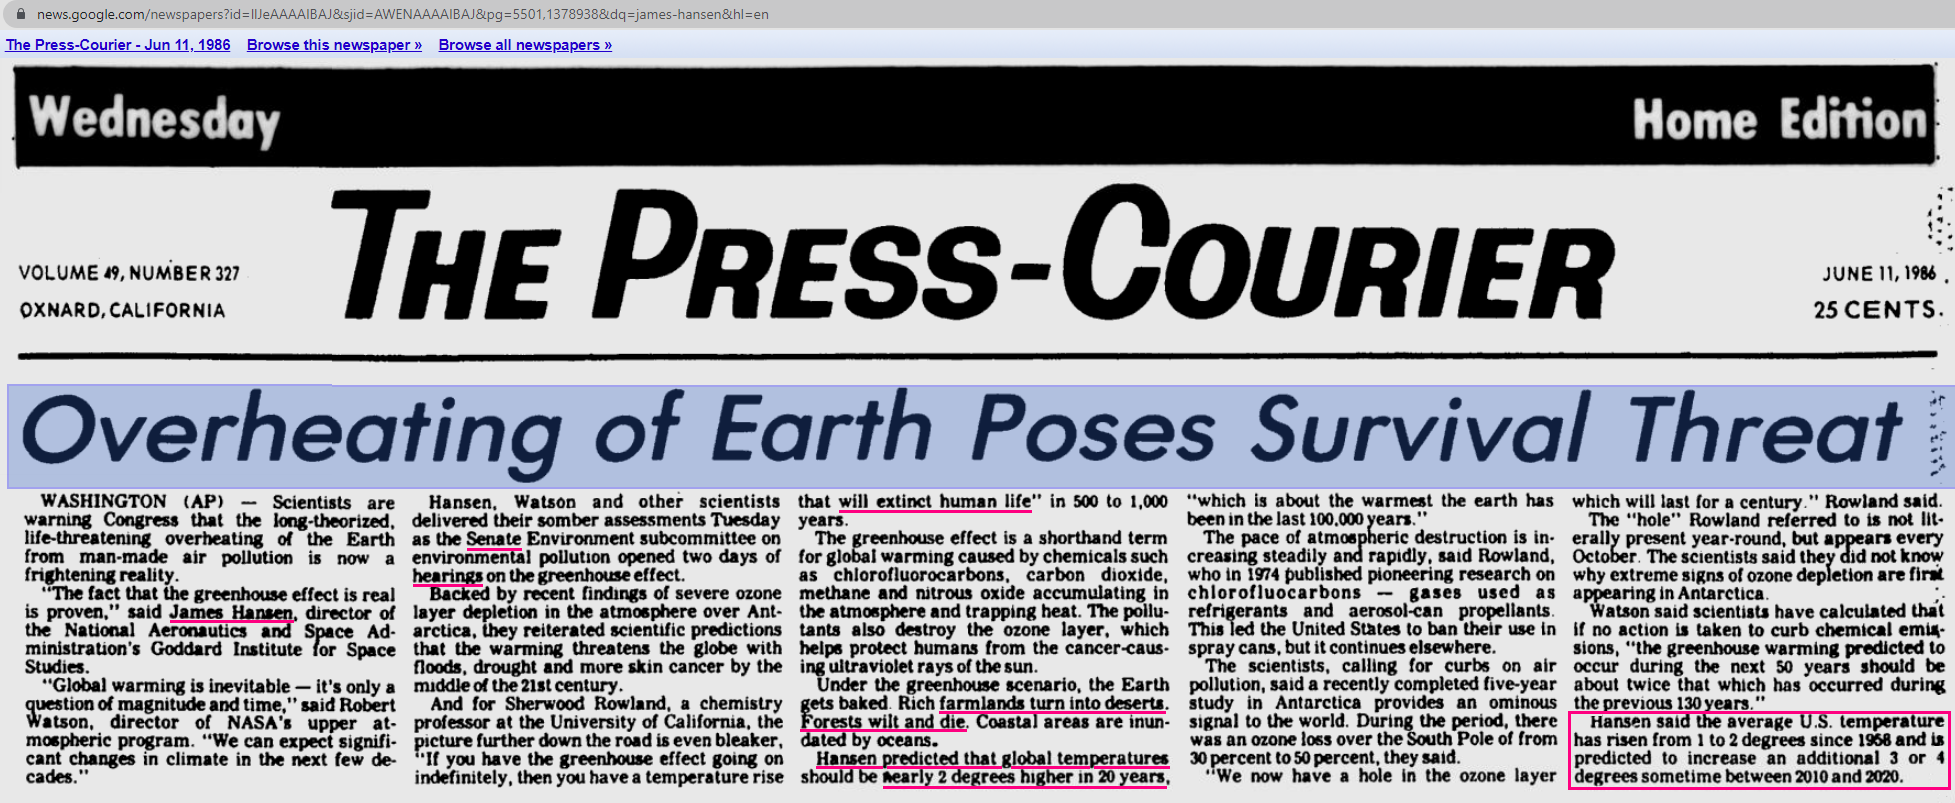
https://sealevel.info/Post-Courier_1986-06-11_article_about_Hansen_congressional_testimony03.png
T R A N S C R I P T
Congressional Testimony of Dr. James Hansen, June 23, 1988
On June 23, 1988, James Hansen of the NASA Goddard Space Institute gave testimony to the U.S. Senate Committee on Energy and Natural Resources.
Opening Statement to the Committee, by Dr. James Hansen, Director, NASA Goddard Institute for Space Studies
Mr. Chairman and committee members, thank you for the opportunity to present the results of my research on the greenhouse effect which has been carried out with my colleagues at the NASA Goddard Institute for Space Studies.
I would like to draw three main conclusions. Number one, the earth is warmer in 1988 than at any time in the history of instrumental measurements. Number two, the global warming is now large enough that we can ascribe with a high degree of confidence a cause and effect relationship to the greenhouse effect. And number three, our computer climate simulations indicate that the greenhouse effect is already large enough to begin to effect the probability of extreme events such as summer heat waves.
My first viewgraph shows the global temperature over the period of instrumental records which is about 100 years. The present temperature is the highest in the period of record. The rate of warming in the past 25 years, as you can see on the right, is the highest on record. The four warmest years, as the Senator mentioned, have all been in the 1980s. And 1988 so far is so much warmer than 1987, that barring a remarkable and improbable cooling, 1988 will the warmest year on the record.
Now let me turn to my second point which is causal association of the greenhouse effect and the global warming. Causal association requires first that the warming be larger than natural climate variability and, second that the magnitude and nature of the warming be consistent with the greenhouse mechanism. These points are both addressed in my second viewgraph. The observed warming during the past 30 years, which is the period when we have accurate measurements of atmospheric composition, is shown by the heavy black line in this graph. The warming is almost 0.4 degrees Centigrade by 1987 relative to climatology, which is defined as the 30-year mean, 1950 to 1980 and, in fact, the warming is more than 0.4 degrees Centigrade in 1988. The probability of a chance warming of that magnitude is about 1 percent. So with 99 percent confidence we can state that the warming during this time period is a real warming trend.
The other curves in this figure are the results of global climate model calculations for three scenarios of atmospheric trace gas growth. We have considered several scenarios because there are uncertainties in the exact trace gas growth in the past and especially in the future. We have considered cases ranging from business as usual, which is scenario A, to draconian emission cuts, scenario C, which would totally eliminate net trace gas growth by the year 2000.
The main point to be made here is that the expected global warming is of the same magnitude as the observed warming. Since there is only a 1 percent chance of an accidental warming of this magnitude, the agreement with the expected greenhouse effect is of considerable significance. Moreover, if you look at the next level of detail in the global temperature change, there are clear signs of the greenhouse gas effect. Observational data suggests a cooling in the stratosphere while the ground is warming. The data suggest somewhat more warming over land and sea ice regions than over open ocean, more warming at high latitudes than at low latitudes, and more warming in the winter than in the summer. In all of these cases, the signal is at best just beginning to emerge, and we need more data. Some of these details, such as the northern hemisphere high latitude temperature trends, do not look exactly like the greenhouse effect, but that is expected. There are certainly other climate factors involved in addition to the greenhouse effect.
Altogether the evidence that the earth is warming by an amount which is too large to be a chance fluctuation and the similarity of the warming to that expected from the greenhouse effect represents a very strong case. In my opinion, that the greenhouse effect has been detected, and it is changing our climate now.
Then my third point. Finally, I would like to address the question of whether the greenhouse effect is already large enough to affect the probability of extreme events, such as summer heat waves. As shown in my next viewgraph, we have used the temperature changes computed in our global climate model to estimate the impact of the greenhouse effect on the frequency of hot summers in Washington, D.C. and Omaha, Nebraska. A hot summer is defined as the hottest one-third of the summers in the 1950 to 1980 period, which is the period the Weather Bureau uses for defining climatology. So, in that period the probability of having a hot summer was 33 percent, but by the 1990s, you can see that the greenhouse effect has increased the probability of a hot summer to somewhere between 55 percent and 70 percent in Washington according to our climate model simulations. In the late 1980s, the probability of a hot summer would be somewhat less than that. You can interpolate to a value of something like 40 to 60 percent.
I believe that this change in the frequency of hot summers is large enough to be noticeable to the average person. So, we have already reached a point that the greenhouse effect is important. It may also have important implications other than for creature comforts.
My last viewgraph shows global maps of temperature anomalies for a particular month, July, for several different years between 1986 and 2029, as computed with our global climate model for the intermediate trace gas scenario B. As shown by the graphs on the left where yellow and red colors represent areas that are warmer than climatology and blue areas represent areas that are colder than climatology, at the present time in the 1980s the greenhouse warming is smaller than the natural variability of the local temperature. So, in any given month, there is almost as much area that is cooler than normal as there is warmer than normal. A few decades in the future, as shown on the right, it is warm almost everywhere.
However, the point that I would like to make is that in the late 1980s and in the 1990s we notice a clear tendency in our model for greater than average warming in the southeast United States and the Midwest. In our model this result seems to arise because the Atlantic Ocean of the coast of the United States warms more slowly than the land. This leads to high pressure along the east coast and circulation of warm air north into the Midwest or southeast. There is only a tendency for this phenomenon. It is certainly not going to happen every, and climate models are certainly an imperfect tool at this time. However, we conclude that there is evidence that the greenhouse effect increases the likelihood of heat wave drought situations in the southeast and Midwest United States even though we cannot blame a specific drought on the greenhouse effect.
Therefore, I believe that it is not a good idea to use the period 1950 to 1980 for which climatology is normally defined as an indication of how frequently droughts will occur in the future. If our model is approximately correct, such situations may be more common in the next 10 to 15 years than they were in the period 1950 to 1980.
Finally, I would like to stress that there is a need for improving these global climate models, and there is a need for global observations if we’re going to obtain a full understanding of these phenomena.
That concludes my statement, and I'd be glad to answer questions if you'd like.
[The prepared statement of Dr. Hansen follows:]
The Greenhouse Effect: Impacts on Current Global Temperature and Regional Heat Waves; Presented to United States Senate Committee on Energy and Natural Resources, June 23, 1988
Preface
This statement is based largely on recent studies carried out with my colleagues S. Lebedeff, D. Rind, I. Fung, A. Lacis, R. Ruedy, G. Russell, and P. Stone at the NASA Goddard Institute for Space Studies.
My principal conclusion are: (1) the earth is warmer in 1988 than at any time in the history of instrumental measurements, (2) the global warming is now sufficiently large that we can ascribe with a high degree of confidence a cause and effect relationship to the greenhouse effect, and (3) in our computer climate simulations the greenhouse effect now is already large enough to begin to effect the probability of occurrence of extreme events such as summer heat waves; the model results imply that heat wave/drought occurrences in the Southeast and Midwest United States may be more frequent in the next decade than in climatological (1950 – 1980) statistics.
1. Current global temperatures
Present global temperatures are the highest in the period of instrumental records. The rate of global warming in the past two decades is higher than at any earlier time in the record. The four warmest years in the past century all have occurred in the 1980s.
The global temperature in 1988 up to June 1 is substantially warmer than the like period in any previous year in the record. The most recent two seasons (Dec.-Jan.-Feb. and Mar.-Apr.-May 1988) are the warmest in the entire record. The first five months are so warm globally that we conclude that 1988 will be the warmest year on record unless there is a remarkable, improbable cooling in the remainder of the year.
2 Relationship of global warming and greenhouse effect
Causal association of current global warming with the greenhouse effect requires determination that (1) the warming is larger than natural climate variability, and (2) the magnitude and nature of the warming is consistent with the greenhouse warming mechanism. Both of these issues are addressed quantitatively in Fig. 3, which compares recent observed global temperature change with climate model simulations of temperature changes expected to result from the greenhouse effect.
The present observed global warming is close to 0.4 degrees C, relative to ‘climatology,’ which is defined as the thirty-year (1951 – 1980) mean. A warming of 0.4 degrees C is three times larger than the standard deviation of annual mean temperatures in the 30-year climatology. The standard deviation of 0.13 degrees C is a typical amount by which the global temperature fluctuates annually about its 30-year mean; the probability of a chance warming of three standard deviations is about 1 percent. Thus, we can state with about 99 percent confidence that current temperatures represent a real warming trend rather than a chance fluctuation over the 30-year period.
We have made computer simulations of the greenhouse effect for the period since 1958, when atmospheric CO2 began to be measured accurately. A range of trace gas scenarios is considered so as to account for moderate uncertainties in trace gas histories and larger uncertainties in future trace gas growth rates. The nature of the numerical climate model used for these simulations is described in attachment A. There are major uncertainties in the model, which arise especially from assumptions about (1) global climate sensitivity and (2) heat uptake and transport by the ocean, as discussed in attachment A. However, the magnitude of temperature changes computed with our climate model in various test cases is generally consistent with a body of empirical evidence and with sensitivities of other climate models.
The global temperature change simulated by the model yields a warming over the past 30 years similar in magnitude to the observed warming. In both the observations and model, the warming is close to 0.4 degrees C by 1987, which is the 99 percent confidence level.
It is important to compare the spatial distribution of observed temperature changes with computer model simulations of the greenhouse effect, and also to search for other global changes related to the greenhouse effect, for example, changes in ocean heat content and sea ice coverage. As yet, it is difficult to obtain definitive conclusions from such comparisons, in part because the natural variability of regional temperatures is much larger than that of global mean temperature. However, the climate model simulations indicate that certain gross characteristics of the greenhouse warming should begin to appear soon, for example, somewhat greater warming at high latitudes than at low latitudes, greater warming over continents than over oceans, and cooling in the stratosphere while the troposphere warms. Indeed, observations contain evidence for all these characteristics, but much more study and improved records are needed to establish the significance of trends and to use the spatial information to understand better the greenhouse effect. Analyses must account for the fact that there are climate change mechanisms at work, besides the greenhouse effect; other anthropogenic effects, such as changes in surface albedo and tropospheric aerosols, are likely to be especially important in the Northern Hemisphere.
We can also examine the greenhouse warming over the full period for which global temperature change has been measured, which is approximately the past 100 years. On such a longer period the natural variability of global temperature is larger; the standard deviation of global temperature for the past century is 0.2 degrees C. The observed warming over the past century is 0.6 – 0.7 degrees C. Simulated greenhouse warming for the past century is in the range of 0.5 to 1.0 degrees C, depending upon various modeling assumptions. Thus, although there are greater uncertainties about climate forcings in the past century than in the past 30 years, the observed and simulated greenhouse warming are consistent on both these time scales.
Conclusion
Global warming has reached a level such that we can ascribe with a high degree of confidence a cause and effect relationship between the greenhouse effect and the observed warming. Certainly further study of this issue must be made. The detection of a global greenhouse signal represents only a first step in analysis of the phenomenon.
3. Greenhouse impacts on summer heat waves
Global climate models are not yet sufficiently realistic to provide reliable predictions of the impact of greenhouse warming on detailed regional climate patterns. However, it is useful to make initial studies with state-of-the-art climate models; the results can be examined to see whether there are regional climate change predictions which can be related to plausible physical mechanisms. At the very least, such studies help focus the work needed to develop improved climate models and to analyze observed climate change.
One prediction regional climate change which has emerged in such climate model studies of the greenhouse effect is a tendency for mid-latitude continental drying in the summer (references 3, 4, 5). Dr. Manabe will address this important issue in his testimony today. Most of these studies have been for the case of doubled atmospheric CO2, a condition which may occur by the middle of the next century.
Our studies during the past several years at the Goddard Institute for Space Studies have focused on the expected transient climate change during the next few decades, as described in the attachment to my testimony. Typical results from our simulation for trace gas scenario B shows computed July temperature anomalies in several years between 1986 and 2029. In the 1980s, the global warming is small compared to the natural variability of local monthly mean temperatures; thus, the area with cool temperatures in a given July is almost as great as the area with warm temperatures. However, within about a decade the area with above normal temperatures becomes much larger than the area with cooler temperatures.
The specific temperature patterns for any given month and year should not be viewed as predictions for that specific time, because they depend upon unpredictable weather fluctuations. However, characteristics which tend to repeat warrant further study, especially if they occur for different trace gas scenarios. We find a tendency in our simulations of the late 1980s and the 1990s for greater than average warming in the Southeast and Midwest United States. These areas of high temperatures are usually accompanied by below normal precipitation.
Examination of the changes in sea level pressure and atmospheric winds in the model suggests that the tendency for larger than normal warming in the Midwest and Southeast is related to the ocean's response time; the relatively slow warming of surface waters in the mid-Atlantic off the Eastern United States and in the Pacific off California tends to increase sea level pressure in those ocean regions and this in turn tends to cause more southerly winds in the eastern United States and more northerly winds in the western United States. However, the tendency is too small to be apparent every year; in some years in the 1990s, the eastern United States is cooler than climatology (the control run mean).
Conclusion
It is not possible to blame a specific heatwave/drought on the greenhouse effect. However, there is evidence that the greenhouse effect increases the likelihood of such events; our climate model simulations for the late 1980s and the 1990s indicate a tendency for an increase of heatwave/drought situations in the Southeast and Midwest United States. We note that the correlations between climate models and observed temperatures are often very poor at subcontinental scales, particularly during Northern Hemisphere summer (reference 7). Thus, improved understanding of these phenomena depends upon the development of increasingly realistic global climate models and upon the availability of global observations needed to verify and improve the models.
References
- Hansen, J., I. Fung, A. Lacis, D. Rind, G. Russell, S. Labedeff, R. Ruedy and P. Stone, 1988, Global climate changes as forecast by the GISS 3-D model, J. Geophys. Res. (in press).
- Hansen, J., A. Lacis, D. Rind, G. Russell, P. Stone, I. Fung, R. Ruedy and J. Lerner, 1984, Climate sensitivity: analysis of feedback mechanisms, Geophys. Mono., 29, 130 – 163.
- Manabe, S., R. T. Wetherald and R. J. Steuffer, 1981, Summer dryness due to an increase in atmospheric CO2 concentration, Climate Change, 3, 347 – 386.
- Manabe, S. and R. T. Wetherald, 1986, Reduction in summer soil wetness induced by an increase in atmospheric carbon dioxide, Science, 232, 626 – 628.
- Manabe, S. and R. T. Wetherald, 1987, Large-scale changes of soil wetness induced by an increase in atmospheric carbon dioxide, J. Atmos. Sci., 44, 1211 – 1235.
- Hansen, J. and S. Lebedeff, 1987, Global trends of measured surface air temperature, J. Geophys. Res., 92, 13, 345 – 13, 372,; Hansen, J. and S. Lebedeff, 1988, Global surface air temperatures: update through 1987, Geophys. Res. Lett., 15, 323 – 326.
- Crotch, S., 1988, Regional intercomparisons of general circulation model predictions and historical climate data, Dept. of Energy Report, DOE/NBA-0084.


